dates
matplotlib.dates
Matplotlib provides sophisticated date plotting capabilities, standing on the shoulders of python datetime, the add-on modules pytz and dateutil. datetime objects are converted to floating point numbers which represent time in days since 0001-01-01 UTC, plus 1. For example, 0001-01-01, 06:00 is 1.25, not 0.25. The helper functions date2num(), num2date() and drange() are used to facilitate easy conversion to and from datetime and numeric ranges.
Note
Like Python?s datetime, mpl uses the Gregorian calendar for all conversions between dates and floating point numbers. This practice is not universal, and calendar differences can cause confusing differences between what Python and mpl give as the number of days since 0001-01-01 and what other software and databases yield. For example, the US Naval Observatory uses a calendar that switches from Julian to Gregorian in October, 1582. Hence, using their calculator, the number of days between 0001-01-01 and 2006-04-01 is 732403, whereas using the Gregorian calendar via the datetime module we find:
In [31]:date(2006,4,1).toordinal() - date(1,1,1).toordinal()
Out[31]:732401
A wide range of specific and general purpose date tick locators and formatters are provided in this module. See matplotlib.ticker for general information on tick locators and formatters. These are described below.
All the matplotlib date converters, tickers and formatters are timezone aware, and the default timezone is given by the timezone parameter in your matplotlibrc file. If you leave out a tz timezone instance, the default from your rc file will be assumed. If you want to use a custom time zone, pass a pytz.timezone instance with the tz keyword argument to num2date(), plot_date(), and any custom date tickers or locators you create. See pytz for information on pytz and timezone handling.
The dateutil module provides additional code to handle date ticking, making it easy to place ticks on any kinds of dates. See examples below.
Date tickers
Most of the date tickers can locate single or multiple values. For example:
# import constants for the days of the week
from matplotlib.dates import MO, TU, WE, TH, FR, SA, SU

# tick on mondays every week
loc = WeekdayLocator(byweekday=MO, tz=tz)

# tick on mondays and saturdays
loc = WeekdayLocator(byweekday=(MO, SA))
In addition, most of the constructors take an interval argument:
# tick on mondays every second week
loc = WeekdayLocator(byweekday=MO, interval=2)
The rrule locator allows completely general date ticking:
# tick every 5th easter
rule = rrulewrapper(YEARLY, byeaster=1, interval=5)
loc = RRuleLocator(rule)
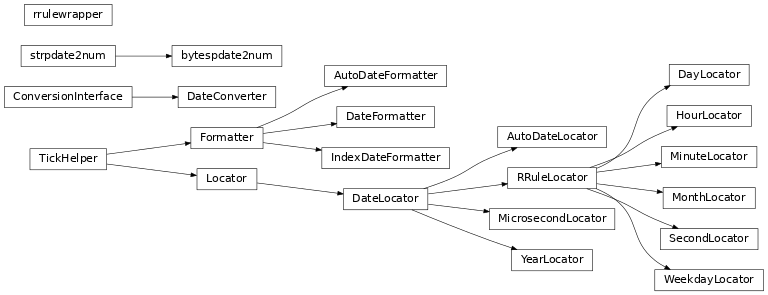
Here are all the date tickers:
-
MinuteLocator: locate minutes -
HourLocator: locate hours -
DayLocator: locate specifed days of the month -
WeekdayLocator: Locate days of the week, e.g., MO, TU -
MonthLocator: locate months, e.g., 7 for july -
YearLocator: locate years that are multiples of base -
RRuleLocator: locate using amatplotlib.dates.rrulewrapper. Therrulewrapperis a simple wrapper around adateutil.rrule(dateutil) which allow almost arbitrary date tick specifications. See rrule example. -
AutoDateLocator: On autoscale, this class picks the bestMultipleDateLocatorto set the view limits and the tick locations.
Date formatters
Here all all the date formatters:
-
AutoDateFormatter: attempts to figure out the best format to use. This is most useful when used with theAutoDateLocator. -
DateFormatter: usestrftime()format strings -
IndexDateFormatter: date plots with implicit x indexing.
-
matplotlib.dates.date2num(d) -
d is either a
datetimeinstance or a sequence of datetimes.Return value is a floating point number (or sequence of floats) which gives the number of days (fraction part represents hours, minutes, seconds) since 0001-01-01 00:00:00 UTC, plus one. The addition of one here is a historical artifact. Also, note that the Gregorian calendar is assumed; this is not universal practice. For details, see the module docstring.
-
matplotlib.dates.num2date(x, tz=None) -
x is a float value which gives the number of days (fraction part represents hours, minutes, seconds) since 0001-01-01 00:00:00 UTC plus one. The addition of one here is a historical artifact. Also, note that the Gregorian calendar is assumed; this is not universal practice. For details, see the module docstring.
Return value is a
datetimeinstance in timezone tz (default to rcparams TZ value).If x is a sequence, a sequence of
datetimeobjects will be returned.
-
matplotlib.dates.drange(dstart, dend, delta) -
Return a date range as float Gregorian ordinals. dstart and dend are
datetimeinstances. delta is adatetime.timedeltainstance.
-
matplotlib.dates.epoch2num(e) -
Convert an epoch or sequence of epochs to the new date format, that is days since 0001.
-
matplotlib.dates.num2epoch(d) -
Convert days since 0001 to epoch. d can be a number or sequence.
-
matplotlib.dates.mx2num(mxdates) -
Convert mx
datetimeinstance (or sequence of mx instances) to the new date format.
-
class matplotlib.dates.DateFormatter(fmt, tz=None) -
Bases:
matplotlib.ticker.FormatterTick location is seconds since the epoch. Use a
strftime()format string.Python only supports
datetimestrftime()formatting for years greater than 1900. Thanks to Andrew Dalke, Dalke Scientific Software who contributed thestrftime()code below to include dates earlier than this year.-
fmt is a strftime() format string; tz is the -
tzinfoinstance.
-
illegal_s = re.compile('((^|[^%])(%%)*%s)')
-
set_tzinfo(tz)
-
strftime(dt, fmt=None) -
Refer to documentation for datetime.strftime.
fmt is a
strftime()format string.Warning: For years before 1900, depending upon the current locale it is possible that the year displayed with %x might be incorrect. For years before 100, %y and %Y will yield zero-padded strings.
-
strftime_pre_1900(dt, fmt=None) -
Call time.strftime for years before 1900 by rolling forward a multiple of 28 years.
fmt is a
strftime()format string.Dalke: I hope I did this math right. Every 28 years the calendar repeats, except through century leap years excepting the 400 year leap years. But only if you?re using the Gregorian calendar.
-
-
class matplotlib.dates.IndexDateFormatter(t, fmt, tz=None) -
Bases:
matplotlib.ticker.FormatterUse with
IndexLocatorto cycle format strings by index.t is a sequence of dates (floating point days). fmt is a
strftime()format string.
-
class matplotlib.dates.AutoDateFormatter(locator, tz=None, defaultfmt='%Y-%m-%d') -
Bases:
matplotlib.ticker.FormatterThis class attempts to figure out the best format to use. This is most useful when used with the
AutoDateLocator.The AutoDateFormatter has a scale dictionary that maps the scale of the tick (the distance in days between one major tick) and a format string. The default looks like this:
self.scaled = {
   365.0  : '%Y',
   30.    : '%b %Y',
   1.0    : '%b %d %Y',
   1./24. : '%H:%M:%S',
   1. / (24. * 60.): '%H:%M:%S.%f',
   }
The algorithm picks the key in the dictionary that is >= the current scale and uses that format string. You can customize this dictionary by doing:
>>> locator = AutoDateLocator()
>>> formatter = AutoDateFormatter(locator)
>>> formatter.scaled[1/(24.*60.)] = '%M:%S' # only show min and sec
A custom
FuncFormattercan also be used. The following example shows how to use a custom format function to strip trailing zeros from decimal seconds and adds the date to the first ticklabel:>>> def my_format_function(x, pos=None): ... x = matplotlib.dates.num2date(x) ... if pos == 0: ... fmt = '%D %H:%M:%S.%f' ... else: ... fmt = '%H:%M:%S.%f' ... label = x.strftime(fmt) ... label = label.rstrip("0") ... label = label.rstrip(".") ... return label >>> from matplotlib.ticker import FuncFormatter >>> formatter.scaled[1/(24.*60.)] = FuncFormatter(my_format_function)Autoformat the date labels. The default format is the one to use if none of the values in
self.scaledare greater than the unit returned bylocator._get_unit().
-
class matplotlib.dates.DateLocator(tz=None) -
Bases:
matplotlib.ticker.LocatorDetermines the tick locations when plotting dates.
tz is a
tzinfoinstance.-
datalim_to_dt() -
Convert axis data interval to datetime objects.
-
hms0d = {'byhour': 0, 'byminute': 0, 'bysecond': 0}
-
nonsingular(vmin, vmax) -
Given the proposed upper and lower extent, adjust the range if it is too close to being singular (i.e. a range of ~0).
-
set_tzinfo(tz) -
Set time zone info.
-
viewlim_to_dt() -
Converts the view interval to datetime objects.
-
-
class matplotlib.dates.RRuleLocator(o, tz=None) -
Bases:
matplotlib.dates.DateLocator-
autoscale() -
Set the view limits to include the data range.
-
static get_unit_generic(freq)
-
tick_values(vmin, vmax)
-
-
class matplotlib.dates.AutoDateLocator(tz=None, minticks=5, maxticks=None, interval_multiples=False) -
Bases:
matplotlib.dates.DateLocatorOn autoscale, this class picks the best
DateLocatorto set the view limits and the tick locations.minticks is the minimum number of ticks desired, which is used to select the type of ticking (yearly, monthly, etc.).
maxticks is the maximum number of ticks desired, which controls any interval between ticks (ticking every other, every 3, etc.). For really fine-grained control, this can be a dictionary mapping individual rrule frequency constants (YEARLY, MONTHLY, etc.) to their own maximum number of ticks. This can be used to keep the number of ticks appropriate to the format chosen in
AutoDateFormatter. Any frequency not specified in this dictionary is given a default value.tz is a
tzinfoinstance.interval_multiples is a boolean that indicates whether ticks should be chosen to be multiple of the interval. This will lock ticks to ?nicer? locations. For example, this will force the ticks to be at hours 0,6,12,18 when hourly ticking is done at 6 hour intervals.
The AutoDateLocator has an interval dictionary that maps the frequency of the tick (a constant from dateutil.rrule) and a multiple allowed for that ticking. The default looks like this:
self.intervald = {
  YEARLY  : [1, 2, 4, 5, 10, 20, 40, 50, 100, 200, 400, 500,
            1000, 2000, 4000, 5000, 10000],
  MONTHLY : [1, 2, 3, 4, 6],
  DAILY   : [1, 2, 3, 7, 14],
  HOURLY  : [1, 2, 3, 4, 6, 12],
  MINUTELY: [1, 5, 10, 15, 30],
  SECONDLY: [1, 5, 10, 15, 30],
  MICROSECONDLY: [1, 2, 5, 10, 20, 50, 100, 200, 500, 1000, 2000,
                 5000, 10000, 20000, 50000, 100000, 200000, 500000,
                 1000000],
  }
The interval is used to specify multiples that are appropriate for the frequency of ticking. For instance, every 7 days is sensible for daily ticks, but for minutes/seconds, 15 or 30 make sense. You can customize this dictionary by doing:
locator = AutoDateLocator()
locator.intervald[HOURLY] = [3] # only show every 3 hours
-
autoscale() -
Try to choose the view limits intelligently.
-
get_locator(dmin, dmax) -
Pick the best locator based on a distance.
-
nonsingular(vmin, vmax)
-
refresh() -
Refresh internal information based on current limits.
-
set_axis(axis)
-
tick_values(vmin, vmax)
-
-
class matplotlib.dates.YearLocator(base=1, month=1, day=1, tz=None) -
Bases:
matplotlib.dates.DateLocatorMake ticks on a given day of each year that is a multiple of base.
Examples:
# Tick every year on Jan 1st
locator = YearLocator()

# Tick every 5 years on July 4th
locator = YearLocator(5, month=7, day=4)
Mark years that are multiple of base on a given month and day (default jan 1).
-
autoscale() -
Set the view limits to include the data range.
-
tick_values(vmin, vmax)
-
-
class matplotlib.dates.MonthLocator(bymonth=None, bymonthday=1, interval=1, tz=None) -
Bases:
matplotlib.dates.RRuleLocatorMake ticks on occurances of each month month, e.g., 1, 3, 12.
Mark every month in bymonth; bymonth can be an int or sequence. Default is
range(1,13), i.e. every month.interval is the interval between each iteration. For example, if
interval=2, mark every second occurance.
-
class matplotlib.dates.WeekdayLocator(byweekday=1, interval=1, tz=None) -
Bases:
matplotlib.dates.RRuleLocatorMake ticks on occurances of each weekday.
Mark every weekday in byweekday; byweekday can be a number or sequence.
Elements of byweekday must be one of MO, TU, WE, TH, FR, SA, SU, the constants from
dateutil.rrule, which have been imported into thematplotlib.datesnamespace.interval specifies the number of weeks to skip. For example,
interval=2plots every second week.
-
class matplotlib.dates.DayLocator(bymonthday=None, interval=1, tz=None) -
Bases:
matplotlib.dates.RRuleLocatorMake ticks on occurances of each day of the month. For example, 1, 15, 30.
Mark every day in bymonthday; bymonthday can be an int or sequence.
Default is to tick every day of the month:
bymonthday=range(1,32)
-
class matplotlib.dates.HourLocator(byhour=None, interval=1, tz=None) -
Bases:
matplotlib.dates.RRuleLocatorMake ticks on occurances of each hour.
Mark every hour in byhour; byhour can be an int or sequence. Default is to tick every hour:
byhour=range(24)interval is the interval between each iteration. For example, if
interval=2, mark every second occurrence.
-
class matplotlib.dates.MinuteLocator(byminute=None, interval=1, tz=None) -
Bases:
matplotlib.dates.RRuleLocatorMake ticks on occurances of each minute.
Mark every minute in byminute; byminute can be an int or sequence. Default is to tick every minute:
byminute=range(60)interval is the interval between each iteration. For example, if
interval=2, mark every second occurrence.
-
class matplotlib.dates.SecondLocator(bysecond=None, interval=1, tz=None) -
Bases:
matplotlib.dates.RRuleLocatorMake ticks on occurances of each second.
Mark every second in bysecond; bysecond can be an int or sequence. Default is to tick every second:
bysecond = range(60)interval is the interval between each iteration. For example, if
interval=2, mark every second occurrence.
-
class matplotlib.dates.MicrosecondLocator(interval=1, tz=None) -
Bases:
matplotlib.dates.DateLocatorMake ticks on occurances of each microsecond.
interval is the interval between each iteration. For example, if
interval=2, mark every second microsecond.-
set_axis(axis)
-
set_data_interval(vmin, vmax)
-
set_view_interval(vmin, vmax)
-
tick_values(vmin, vmax)
-
-
class matplotlib.dates.rrule(freq, dtstart=None, interval=1, wkst=None, count=None, until=None, bysetpos=None, bymonth=None, bymonthday=None, byyearday=None, byeaster=None, byweekno=None, byweekday=None, byhour=None, byminute=None, bysecond=None, cache=False) -
Bases:
dateutil.rrule.rrulebaseThat?s the base of the rrule operation. It accepts all the keywords defined in the RFC as its constructor parameters (except byday, which was renamed to byweekday) and more. The constructor prototype is:
rrule(freq)
Where freq must be one of YEARLY, MONTHLY, WEEKLY, DAILY, HOURLY, MINUTELY, or SECONDLY.
Note
Per RFC section 3.3.10, recurrence instances falling on invalid dates and times are ignored rather than coerced:
Recurrence rules may generate recurrence instances with an invalid date (e.g., February 30) or nonexistent local time (e.g., 1:30 AM on a day where the local time is moved forward by an hour at 1:00 AM). Such recurrence instances MUST be ignored and MUST NOT be counted as part of the recurrence set.This can lead to possibly surprising behavior when, for example, the start date occurs at the end of the month:
>>> from dateutil.rrule import rrule, MONTHLY
>>> from datetime import datetime
>>> start_date = datetime(2014, 12, 31)
>>> list(rrule(freq=MONTHLY, count=4, dtstart=start_date))
...
[datetime.datetime(2014, 12, 31, 0, 0),
 datetime.datetime(2015, 1, 31, 0, 0),
 datetime.datetime(2015, 3, 31, 0, 0),
 datetime.datetime(2015, 5, 31, 0, 0)]
Additionally, it supports the following keyword arguments:
Parameters: - cache ? If given, it must be a boolean value specifying to enable or disable caching of results. If you will use the same rrule instance multiple times, enabling caching will improve the performance considerably.
- dtstart ? The recurrence start. Besides being the base for the recurrence, missing parameters in the final recurrence instances will also be extracted from this date. If not given, datetime.now() will be used instead.
- interval ? The interval between each freq iteration. For example, when using YEARLY, an interval of 2 means once every two years, but with HOURLY, it means once every two hours. The default interval is 1.
- wkst ? The week start day. Must be one of the MO, TU, WE constants, or an integer, specifying the first day of the week. This will affect recurrences based on weekly periods. The default week start is got from calendar.firstweekday(), and may be modified by calendar.setfirstweekday().
-
count ?
How many occurrences will be generated.
Note
As of version 2.5.0, the use of the
untilkeyword together with thecountkeyword is deprecated per RFC-2445 Sec. 4.3.10. -
until ?
If given, this must be a datetime instance, that will specify the limit of the recurrence. The last recurrence in the rule is the greatest datetime that is less than or equal to the value specified in the
untilparameter.Note
As of version 2.5.0, the use of the
untilkeyword together with thecountkeyword is deprecated per RFC-2445 Sec. 4.3.10. - bysetpos ? If given, it must be either an integer, or a sequence of integers, positive or negative. Each given integer will specify an occurrence number, corresponding to the nth occurrence of the rule inside the frequency period. For example, a bysetpos of -1 if combined with a MONTHLY frequency, and a byweekday of (MO, TU, WE, TH, FR), will result in the last work day of every month.
- bymonth ? If given, it must be either an integer, or a sequence of integers, meaning the months to apply the recurrence to.
- bymonthday ? If given, it must be either an integer, or a sequence of integers, meaning the month days to apply the recurrence to.
- byyearday ? If given, it must be either an integer, or a sequence of integers, meaning the year days to apply the recurrence to.
- byweekno ? If given, it must be either an integer, or a sequence of integers, meaning the week numbers to apply the recurrence to. Week numbers have the meaning described in ISO8601, that is, the first week of the year is that containing at least four days of the new year.
- byweekday ? If given, it must be either an integer (0 == MO), a sequence of integers, one of the weekday constants (MO, TU, etc), or a sequence of these constants. When given, these variables will define the weekdays where the recurrence will be applied. It?s also possible to use an argument n for the weekday instances, which will mean the nth occurrence of this weekday in the period. For example, with MONTHLY, or with YEARLY and BYMONTH, using FR(+1) in byweekday will specify the first friday of the month where the recurrence happens. Notice that in the RFC documentation, this is specified as BYDAY, but was renamed to avoid the ambiguity of that keyword.
- byhour ? If given, it must be either an integer, or a sequence of integers, meaning the hours to apply the recurrence to.
- byminute ? If given, it must be either an integer, or a sequence of integers, meaning the minutes to apply the recurrence to.
- bysecond ? If given, it must be either an integer, or a sequence of integers, meaning the seconds to apply the recurrence to.
- byeaster ? If given, it must be either an integer, or a sequence of integers, positive or negative. Each integer will define an offset from the Easter Sunday. Passing the offset 0 to byeaster will yield the Easter Sunday itself. This is an extension to the RFC specification.
-
replace(**kwargs) -
Return new rrule with same attributes except for those attributes given new values by whichever keyword arguments are specified.
-
class matplotlib.dates.relativedelta(dt1=None, dt2=None, years=0, months=0, days=0, leapdays=0, weeks=0, hours=0, minutes=0, seconds=0, microseconds=0, year=None, month=None, day=None, weekday=None, yearday=None, nlyearday=None, hour=None, minute=None, second=None, microsecond=None) -
Bases:
objectThe relativedelta type is based on the specification of the excellent work done by M.-A. Lemburg in his mx.DateTime extension. However, notice that this type does NOT implement the same algorithm as his work. Do NOT expect it to behave like mx.DateTime?s counterpart.
There are two different ways to build a relativedelta instance. The first one is passing it two date/datetime classes:
relativedelta(datetime1, datetime2)
The second one is passing it any number of the following keyword arguments:
relativedelta(arg1=x,arg2=y,arg3=z...)

year, month, day, hour, minute, second, microsecond:
    Absolute information (argument is singular); adding or subtracting a
    relativedelta with absolute information does not perform an aritmetic
    operation, but rather REPLACES the corresponding value in the
    original datetime with the value(s) in relativedelta.

years, months, weeks, days, hours, minutes, seconds, microseconds:
    Relative information, may be negative (argument is plural); adding
    or subtracting a relativedelta with relative information performs
    the corresponding aritmetic operation on the original datetime value
    with the information in the relativedelta.

weekday:
    One of the weekday instances (MO, TU, etc). These instances may
    receive a parameter N, specifying the Nth weekday, which could
    be positive or negative (like MO(+1) or MO(-2). Not specifying
    it is the same as specifying +1. You can also use an integer,
    where 0=MO.

leapdays:
    Will add given days to the date found, if year is a leap
    year, and the date found is post 28 of february.

yearday, nlyearday:
    Set the yearday or the non-leap year day (jump leap days).
    These are converted to day/month/leapdays information.
Here is the behavior of operations with relativedelta:
- Calculate the absolute year, using the ?year? argument, or the original datetime year, if the argument is not present.
- Add the relative ?years? argument to the absolute year.
- Do steps 1 and 2 for month/months.
- Calculate the absolute day, using the ?day? argument, or the original datetime day, if the argument is not present. Then, subtract from the day until it fits in the year and month found after their operations.
- Add the relative ?days? argument to the absolute day. Notice that the ?weeks? argument is multiplied by 7 and added to ?days?.
- Do steps 1 and 2 for hour/hours, minute/minutes, second/seconds, microsecond/microseconds.
- If the ?weekday? argument is present, calculate the weekday, with the given (wday, nth) tuple. wday is the index of the weekday (0-6, 0=Mon), and nth is the number of weeks to add forward or backward, depending on its signal. Notice that if the calculated date is already Monday, for example, using (0, 1) or (0, -1) won?t change the day.
-
normalized() -
Return a version of this object represented entirely using integer values for the relative attributes.
>>> relativedelta(days=1.5, hours=2).normalized()
relativedelta(days=1, hours=14)
Returns: Returns a dateutil.relativedelta.relativedeltaobject.
-
weeks
-
matplotlib.dates.seconds(s) -
Return seconds as days.
-
matplotlib.dates.minutes(m) -
Return minutes as days.
-
matplotlib.dates.hours(h) -
Return hours as days.
-
matplotlib.dates.weeks(w) -
Return weeks as days.
Please login to continue.