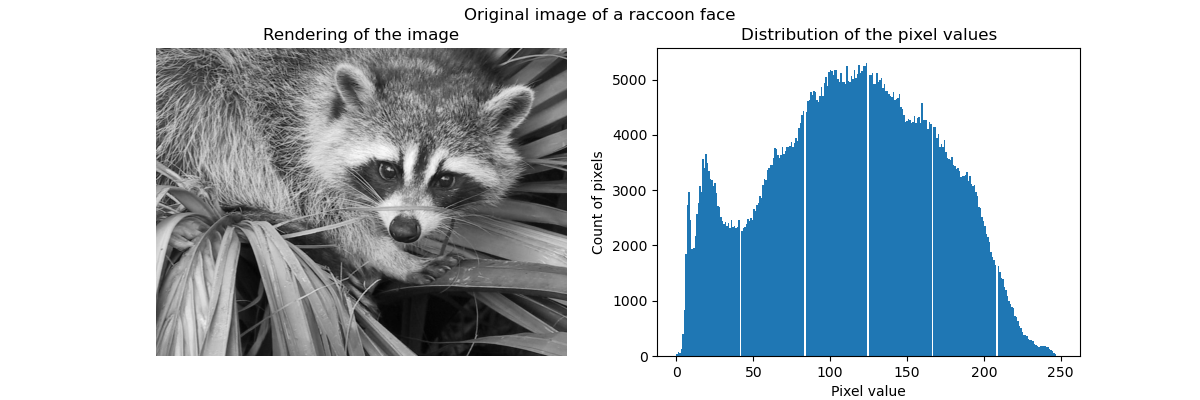
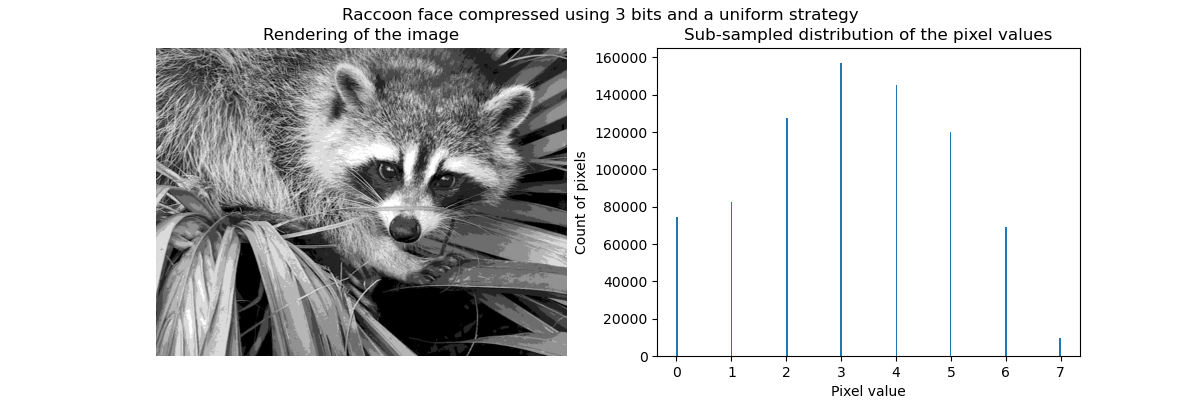
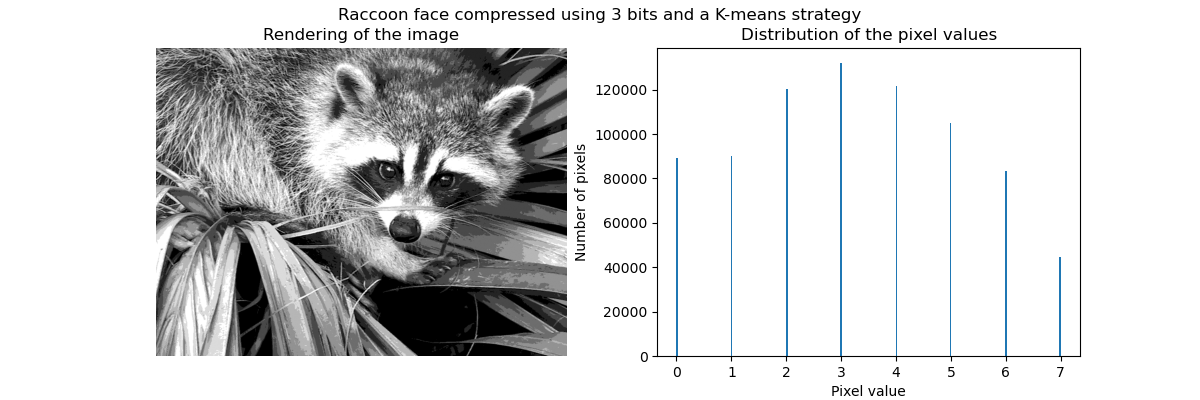
Face, a 1024 x 768 size image of a raccoon face, is used here to illustrate how k-means is used for vector quantization.
print(__doc__)


# Code source: Ga Varoquaux
# Modified for documentation by Jaques Grobler
# License: BSD 3 clause

import numpy as np
import scipy as sp
import matplotlib.pyplot as plt

from sklearn import cluster
from sklearn.utils.testing import SkipTest
from sklearn.utils.fixes import sp_version

if sp_version < (0, 12):
    raise SkipTest("Skipping because SciPy version earlier than 0.12.0 and "
                   "thus does not include the scipy.misc.face() image.")

try:
    face = sp.face(gray=True)
except AttributeError:
    # Newer versions of scipy have face in misc
    from scipy import misc
    face = misc.face(gray=True)

n_clusters = 5
np.random.seed(0)

X = face.reshape((-1, 1))  # We need an (n_sample, n_feature) array
k_means = cluster.KMeans(n_clusters=n_clusters, n_init=4)
k_means.fit(X)
values = k_means.cluster_centers_.squeeze()
labels = k_means.labels_

# create an array from labels and values
face_compressed = np.choose(labels, values)
face_compressed.shape = face.shape

vmin = face.min()
vmax = face.max()

# original face
plt.figure(1, figsize=(3, 2.2))
plt.imshow(face, cmap=plt.cm.gray, vmin=vmin, vmax=256)

# compressed face
plt.figure(2, figsize=(3, 2.2))
plt.imshow(face_compressed, cmap=plt.cm.gray, vmin=vmin, vmax=vmax)

# equal bins face
regular_values = np.linspace(0, 256, n_clusters + 1)
regular_labels = np.searchsorted(regular_values, face) - 1
regular_values = .5 * (regular_values[1:] + regular_values[:-1])  # mean
regular_face = np.choose(regular_labels.ravel(), regular_values, mode="clip")
regular_face.shape = face.shape
plt.figure(3, figsize=(3, 2.2))
plt.imshow(regular_face, cmap=plt.cm.gray, vmin=vmin, vmax=vmax)

# histogram
plt.figure(4, figsize=(3, 2.2))
plt.clf()
plt.axes([.01, .01, .98, .98])
plt.hist(X, bins=256, color='.5', edgecolor='.5')
plt.yticks(())
plt.xticks(regular_values)
values = np.sort(values)
for center_1, center_2 in zip(values[:-1], values[1:]):
    plt.axvline(.5 * (center_1 + center_2), color='b')

for center_1, center_2 in zip(regular_values[:-1], regular_values[1:]):
    plt.axvline(.5 * (center_1 + center_2), color='b', linestyle='--')

plt.show()
Total running time of the script: (0 minutes 3.968 seconds)
Download Python source code:
plot_face_compress.py
Download IPython notebook:
plot_face_compress.ipynb
Please login to continue.