-
RandomState.logseries(p, size=None) -
Draw samples from a logarithmic series distribution.
Samples are drawn from a log series distribution with specified shape parameter, 0 <
p< 1.Parameters: loc : float
scale : float > 0.
size : int or tuple of ints, optional
Output shape. If the given shape is, e.g.,
(m, n, k), thenm * n * ksamples are drawn. Default is None, in which case a single value is returned.Returns: samples : ndarray or scalar
where the values are all integers in [0, n].
See also
-
scipy.stats.distributions.logser - probability density function, distribution or cumulative density function, etc.
Notes
The probability density for the Log Series distribution is
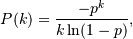
where p = probability.
The log series distribution is frequently used to represent species richness and occurrence, first proposed by Fisher, Corbet, and Williams in 1943 [2]. It may also be used to model the numbers of occupants seen in cars [3].
References
[R166] Buzas, Martin A.; Culver, Stephen J., Understanding regional species diversity through the log series distribution of occurrences: BIODIVERSITY RESEARCH Diversity & Distributions, Volume 5, Number 5, September 1999 , pp. 187-195(9). [R167] Fisher, R.A,, A.S. Corbet, and C.B. Williams. 1943. The relation between the number of species and the number of individuals in a random sample of an animal population. Journal of Animal Ecology, 12:42-58. [R168] D. J. Hand, F. Daly, D. Lunn, E. Ostrowski, A Handbook of Small Data Sets, CRC Press, 1994. [R169] Wikipedia, ?Logarithmic-distribution?, http://en.wikipedia.org/wiki/Logarithmic-distribution Examples
Draw samples from the distribution:
>>> a = .6
>>> s = np.random.logseries(a, 10000)
>>> count, bins, ignored = plt.hist(s)
# plot against distribution
>>> def logseries(k, p): ... return -p**k/(k*log(1-p)) >>> plt.plot(bins, logseries(bins, a)*count.max()/ logseries(bins, a).max(), 'r') >>> plt.show() -
RandomState.logseries()
2025-01-10 15:47:30
Please login to continue.