This example shows how to perform univariate feature selection before running a SVC (support vector classifier) to improve the classification scores.
print(__doc__)

import numpy as np
import matplotlib.pyplot as plt
from sklearn import svm, datasets, feature_selection
from sklearn.model_selection import cross_val_score
from sklearn.pipeline import Pipeline
Import some data to play with
digits = datasets.load_digits()
y = digits.target
# Throw away data, to be in the curse of dimension settings
y = y[:200]
X = digits.data[:200]
n_samples = len(y)
X = X.reshape((n_samples, -1))
# add 200 non-informative features
X = np.hstack((X, 2 * np.random.random((n_samples, 200))))
Create a feature-selection transform and an instance of SVM that we combine together to have an full-blown estimator
transform = feature_selection.SelectPercentile(feature_selection.f_classif)

clf = Pipeline([('anova', transform), ('svc', svm.SVC(C=1.0))])
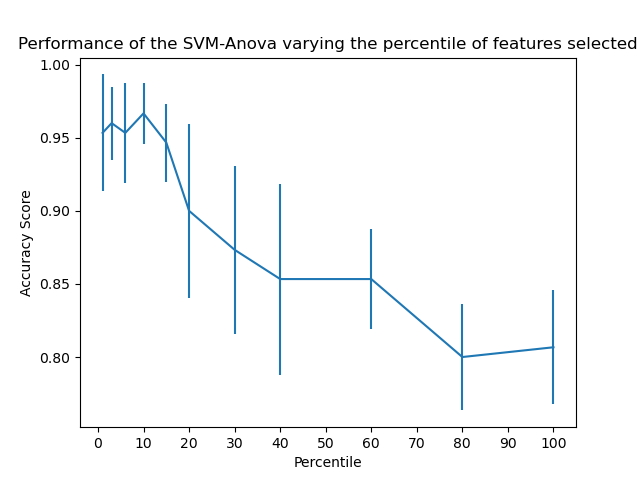
Plot the cross-validation score as a function of percentile of features
score_means = list()
score_stds = list()
percentiles = (1, 3, 6, 10, 15, 20, 30, 40, 60, 80, 100)

for percentile in percentiles:
    clf.set_params(anova__percentile=percentile)
    # Compute cross-validation score using 1 CPU
    this_scores = cross_val_score(clf, X, y, n_jobs=1)
    score_means.append(this_scores.mean())
    score_stds.append(this_scores.std())

plt.errorbar(percentiles, score_means, np.array(score_stds))

plt.title(
    'Performance of the SVM-Anova varying the percentile of features selected')
plt.xlabel('Percentile')
plt.ylabel('Prediction rate')

plt.axis('tight')
plt.show()
Total running time of the script: (0 minutes 0.620 seconds)
Download Python source code:
plot_svm_anova.py
Download IPython notebook:
plot_svm_anova.ipynb
Please login to continue.