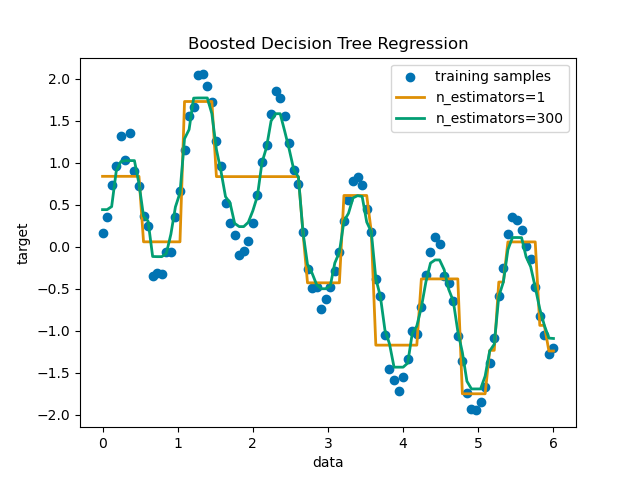
A decision tree is boosted using the AdaBoost.R2 [1] algorithm on a 1D sinusoidal dataset with a small amount of Gaussian noise. 299 boosts (300 decision trees) is compared with a single decision tree regressor. As the number of boosts is increased the regressor can fit more detail.
| [1] |
|
print(__doc__)

# Author: Noel Dawe <noel.dawe@gmail.com>
#
# License: BSD 3 clause

# importing necessary libraries
import numpy as np
import matplotlib.pyplot as plt
from sklearn.tree import DecisionTreeRegressor
from sklearn.ensemble import AdaBoostRegressor

# Create the dataset
rng = np.random.RandomState(1)
X = np.linspace(0, 6, 100)[:, np.newaxis]
y = np.sin(X).ravel() + np.sin(6 * X).ravel() + rng.normal(0, 0.1, X.shape[0])

# Fit regression model
regr_1 = DecisionTreeRegressor(max_depth=4)

regr_2 = AdaBoostRegressor(DecisionTreeRegressor(max_depth=4),
                          n_estimators=300, random_state=rng)

regr_1.fit(X, y)
regr_2.fit(X, y)

# Predict
y_1 = regr_1.predict(X)
y_2 = regr_2.predict(X)

# Plot the results
plt.figure()
plt.scatter(X, y, c="k", label="training samples")
plt.plot(X, y_1, c="g", label="n_estimators=1", linewidth=2)
plt.plot(X, y_2, c="r", label="n_estimators=300", linewidth=2)
plt.xlabel("data")
plt.ylabel("target")
plt.title("Boosted Decision Tree Regression")
plt.legend()
plt.show()
Total running time of the script: (0 minutes 0.742 seconds)
Download Python source code:
plot_adaboost_regression.py
Download IPython notebook:
plot_adaboost_regression.ipynb
Please login to continue.