-
numpy.linalg.lstsq(a, b, rcond=-1)[source] -
Return the least-squares solution to a linear matrix equation.
Solves the equation
a x = bby computing a vectorxthat minimizes the Euclidean 2-norm|| b - a x ||^2. The equation may be under-, well-, or over- determined (i.e., the number of linearly independent rows ofacan be less than, equal to, or greater than its number of linearly independent columns). Ifais square and of full rank, thenx(but for round-off error) is the ?exact? solution of the equation.Parameters: a : (M, N) array_like
?Coefficient? matrix.
b : {(M,), (M, K)} array_like
Ordinate or ?dependent variable? values. If
bis two-dimensional, the least-squares solution is calculated for each of theKcolumns ofb.rcond : float, optional
Cut-off ratio for small singular values of
a. Singular values are set to zero if they are smaller thanrcondtimes the largest singular value ofa.Returns: x : {(N,), (N, K)} ndarray
Least-squares solution. If
bis two-dimensional, the solutions are in theKcolumns ofx.residuals : {(), (1,), (K,)} ndarray
Sums of residuals; squared Euclidean 2-norm for each column in
b - a*x. If the rank ofais < N or M <= N, this is an empty array. Ifbis 1-dimensional, this is a (1,) shape array. Otherwise the shape is (K,).rank : int
Rank of matrix
a.s : (min(M, N),) ndarray
Singular values of
a.Raises: LinAlgError
If computation does not converge.
Notes
If
bis a matrix, then all array results are returned as matrices.Examples
Fit a line,
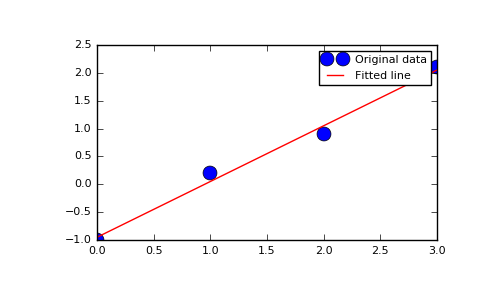
y = mx + c, through some noisy data-points:>>> x = np.array([0, 1, 2, 3]) >>> y = np.array([-1, 0.2, 0.9, 2.1])
By examining the coefficients, we see that the line should have a gradient of roughly 1 and cut the y-axis at, more or less, -1.
We can rewrite the line equation as
y = Ap, whereA = [[x 1]]andp = [[m], [c]]. Now uselstsqto solve forp:>>> A = np.vstack([x, np.ones(len(x))]).T >>> A array([[ 0., 1.], [ 1., 1.], [ 2., 1.], [ 3., 1.]])>>> m, c = np.linalg.lstsq(A, y)[0] >>> print(m, c) 1.0 -0.95
Plot the data along with the fitted line:
>>> import matplotlib.pyplot as plt
>>> plt.plot(x, y, 'o', label='Original data', markersize=10)
>>> plt.plot(x, m*x + c, 'r', label='Fitted line')
>>> plt.legend()
>>> plt.show()
(Source code, png, pdf)
numpy.linalg.lstsq()
2025-01-10 15:47:30
Please login to continue.