-
sklearn.metrics.confusion_matrix(y_true, y_pred, labels=None, sample_weight=None)[source] -
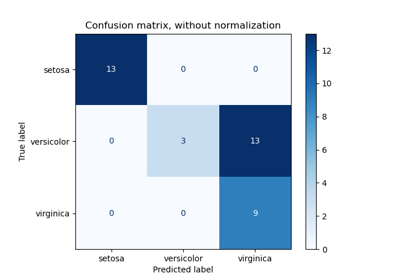
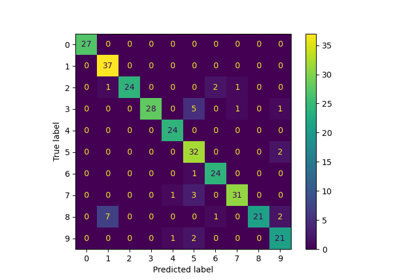
Compute confusion matrix to evaluate the accuracy of a classification
By definition a confusion matrix
 is such that
  is equal to the number of observations known to be in group
  but predicted to be in group
  .
.Thus in binary classification, the count of true negatives is
 , false negatives is
  , true positives is
  and false positives is
  .
.Read more in the User Guide.
Parameters: y_true : array, shape = [n_samples]
Ground truth (correct) target values.
y_pred : array, shape = [n_samples]
Estimated targets as returned by a classifier.
labels : array, shape = [n_classes], optional
List of labels to index the matrix. This may be used to reorder or select a subset of labels. If none is given, those that appear at least once in
y_trueory_predare used in sorted order.sample_weight : array-like of shape = [n_samples], optional
Sample weights.
Returns: C : array, shape = [n_classes, n_classes]
Confusion matrix
References
[R203] Wikipedia entry for the Confusion matrix Examples
>>> from sklearn.metrics import confusion_matrix
>>> y_true = [2, 0, 2, 2, 0, 1]
>>> y_pred = [0, 0, 2, 2, 0, 2]
>>> confusion_matrix(y_true, y_pred)
array([[2, 0, 0],
       [0, 0, 1],
       [1, 0, 2]])
>>> y_true = ["cat", "ant", "cat", "cat", "ant", "bird"] >>> y_pred = ["ant", "ant", "cat", "cat", "ant", "cat"] >>> confusion_matrix(y_true, y_pred, labels=["ant", "bird", "cat"]) array([[2, 0, 0], [0, 0, 1], [1, 0, 2]])
sklearn.metrics.confusion_matrix()
Examples using


2025-01-10 15:47:30
Please login to continue.