Finds core samples of high density and expands clusters from them.
print(__doc__)

import numpy as np

from sklearn.cluster import DBSCAN
from sklearn import metrics
from sklearn.datasets.samples_generator import make_blobs
from sklearn.preprocessing import StandardScaler
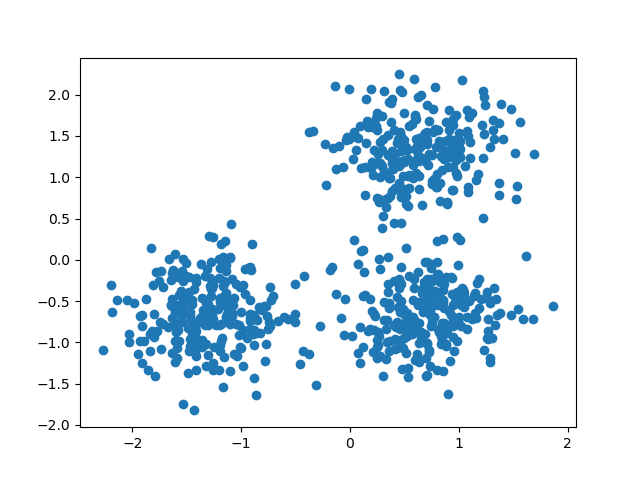
Generate sample data
centers = [[1, 1], [-1, -1], [1, -1]]
X, labels_true = make_blobs(n_samples=750, centers=centers, cluster_std=0.4,
                            random_state=0)

X = StandardScaler().fit_transform(X)
Compute DBSCAN
db = DBSCAN(eps=0.3, min_samples=10).fit(X)
core_samples_mask = np.zeros_like(db.labels_, dtype=bool)
core_samples_mask[db.core_sample_indices_] = True
labels = db.labels_

# Number of clusters in labels, ignoring noise if present.
n_clusters_ = len(set(labels)) - (1 if -1 in labels else 0)

print('Estimated number of clusters: %d' % n_clusters_)
print("Homogeneity: %0.3f" % metrics.homogeneity_score(labels_true, labels))
print("Completeness: %0.3f" % metrics.completeness_score(labels_true, labels))
print("V-measure: %0.3f" % metrics.v_measure_score(labels_true, labels))
print("Adjusted Rand Index: %0.3f"
      % metrics.adjusted_rand_score(labels_true, labels))
print("Adjusted Mutual Information: %0.3f"
      % metrics.adjusted_mutual_info_score(labels_true, labels))
print("Silhouette Coefficient: %0.3f"
      % metrics.silhouette_score(X, labels))
Out:
  Estimated number of clusters: 3
Homogeneity: 0.953
Completeness: 0.883
V-measure: 0.917
Adjusted Rand Index: 0.952
Adjusted Mutual Information: 0.883
Silhouette Coefficient: 0.626
Plot result
import matplotlib.pyplot as plt

# Black removed and is used for noise instead.
unique_labels = set(labels)
colors = plt.cm.Spectral(np.linspace(0, 1, len(unique_labels)))
for k, col in zip(unique_labels, colors):
    if k == -1:
        # Black used for noise.
        col = 'k'

    class_member_mask = (labels == k)

    xy = X[class_member_mask & core_samples_mask]
    plt.plot(xy[:, 0], xy[:, 1], 'o', markerfacecolor=col,
             markeredgecolor='k', markersize=14)

    xy = X[class_member_mask & ~core_samples_mask]
    plt.plot(xy[:, 0], xy[:, 1], 'o', markerfacecolor=col,
             markeredgecolor='k', markersize=6)

plt.title('Estimated number of clusters: %d' % n_clusters_)
plt.show()
Total running time of the script: (0 minutes 0.116 seconds)
Download Python source code:
plot_dbscan.py
Download IPython notebook:
plot_dbscan.ipynb
Please login to continue.